| Next | Welcome to my ~/bin | 37 |
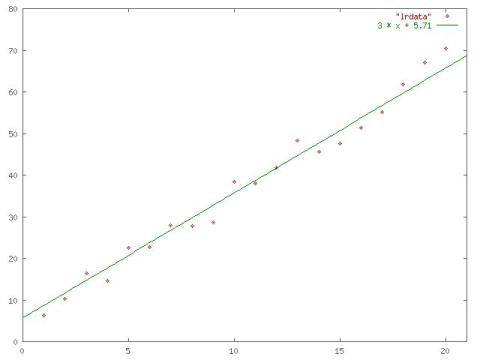
Given input like this:
          1  6.235
          2 10.234
          3 16.308
          4 14.529
          5 22.483
          6 22.739
          7 27.850
          8 27.696
          9 28.646
         10 38.446
         11 37.991
         12 41.801
         13 48.209
         14 45.645
         15 47.638
         16 51.418
         17 55.160
         18 61.785
         19 66.978
         20 70.407
(x values on the left, y values on the right)
It generates output like:
        Xmean 10.5
        Ymean 37.1099
        Xvariance 33.25
        Yvariance 337.81493989
        Xstddev 5.7662812973354
        Ystddev 18.3797426502658
        Slope 3.15999248120301
        Intercept 3.92997894736841
        Correlation 0.991385238128885
"Correlation" measures the degree to which the data is actually linear
| Next | Menu |  |
Copyright © 2005 M. J. Dominus |